Pages: [1]
 ReplySubscribeRSS feedStickyClose   
Author Topic: PID Temperature Controller
Mr.What
Administrator
Posts: 197
Permalink
Post PID Temperature Controller
on: January 12, 2012, 10:48
Quote RemoveEdit

I am intending to use this forum as a blog for my PID temperature controller project, intended for a smokehouse.

Steps I plan to take:

  • Measure the characteristics of the thermistor sensor
  • Build circuit to read sensor over temperature range of interest on an Arduino
  • Build circuit for fan motor speed control on Arduino
  • Write software to set motor speed, and log temperature readings.
  • Use above software to try and measure a step response of my plant (a smoker with fan supplying air to the fire)
  • Use step response data to try and guess good PID control parameters.
  • build full PID control software on Arduino
  • log response of controlled temperature
  • add physical unit calibrations, more human interface.
Mr.What
Administrator
Posts: 197
Permalink
Post Thermistor Calibration
on: January 12, 2012, 13:45
Quote RemoveEdit

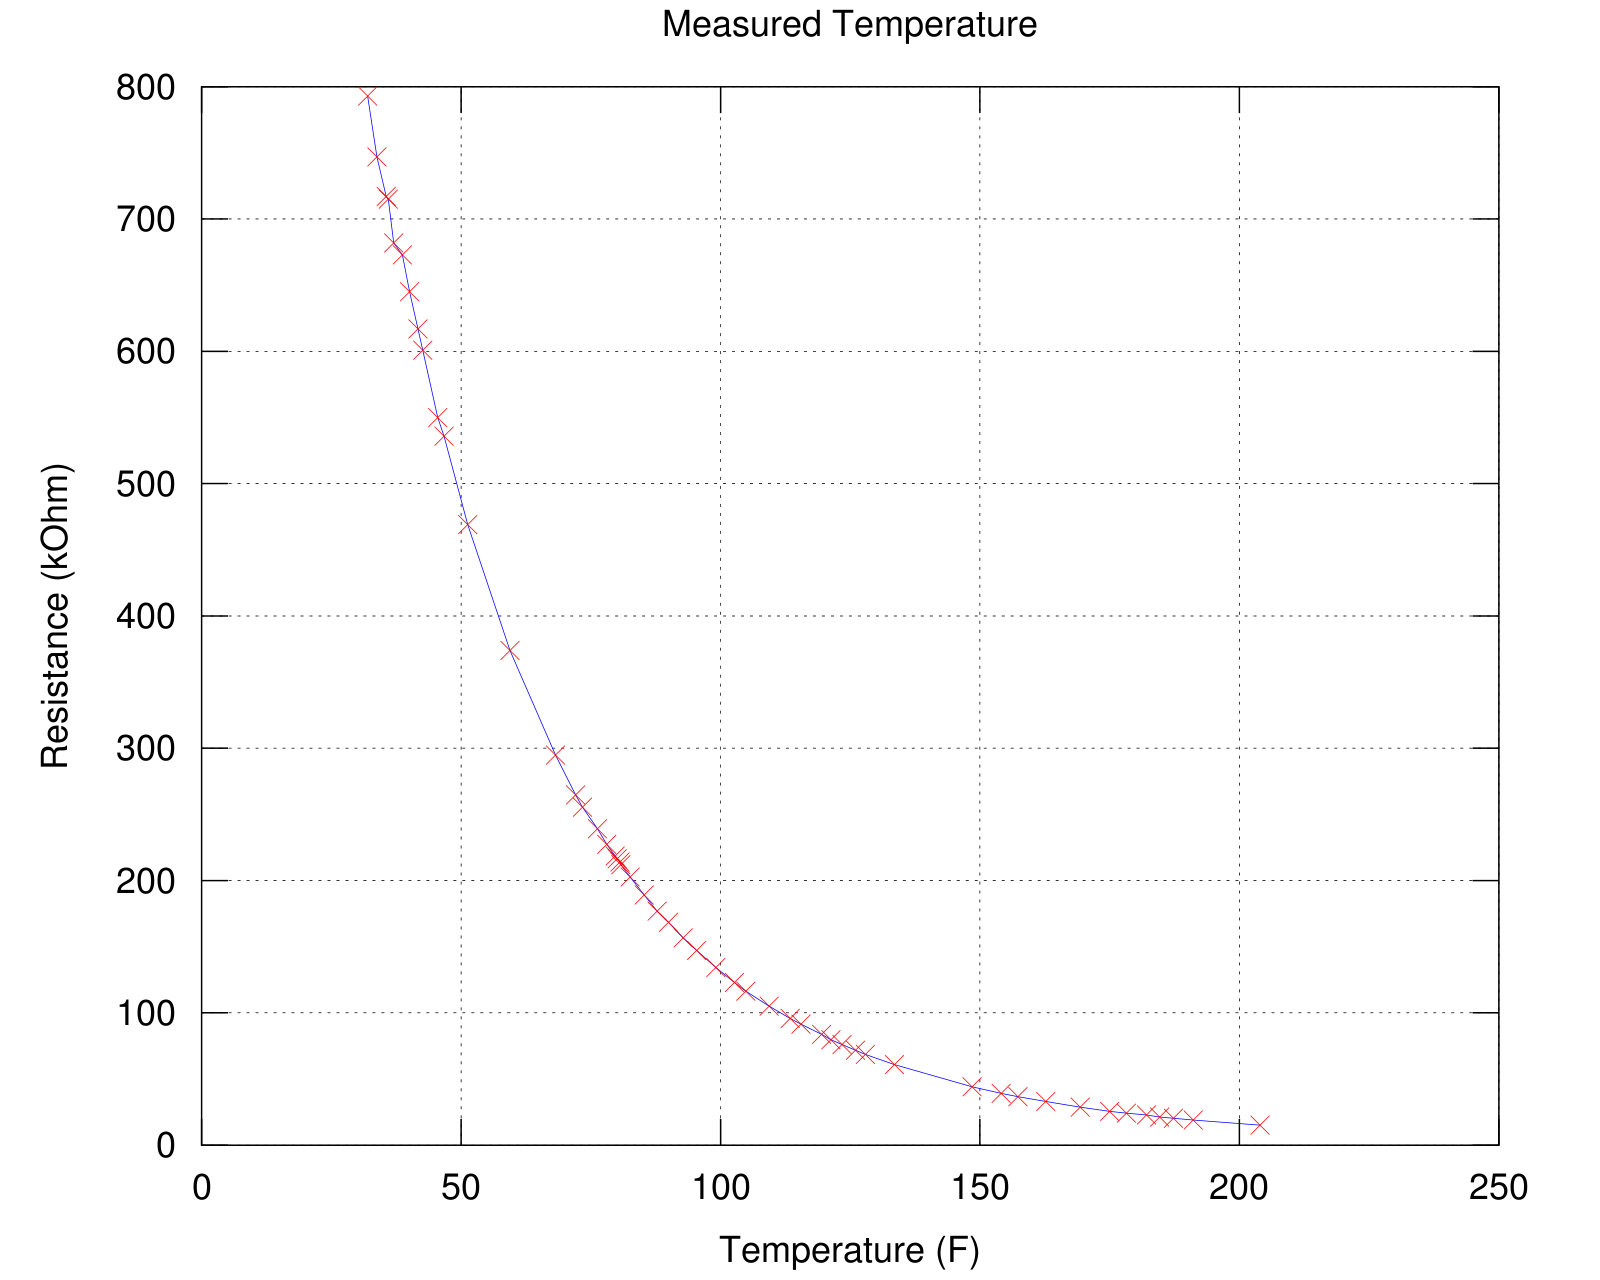
Resistance was measured in water versus another digital thermometer.
Image

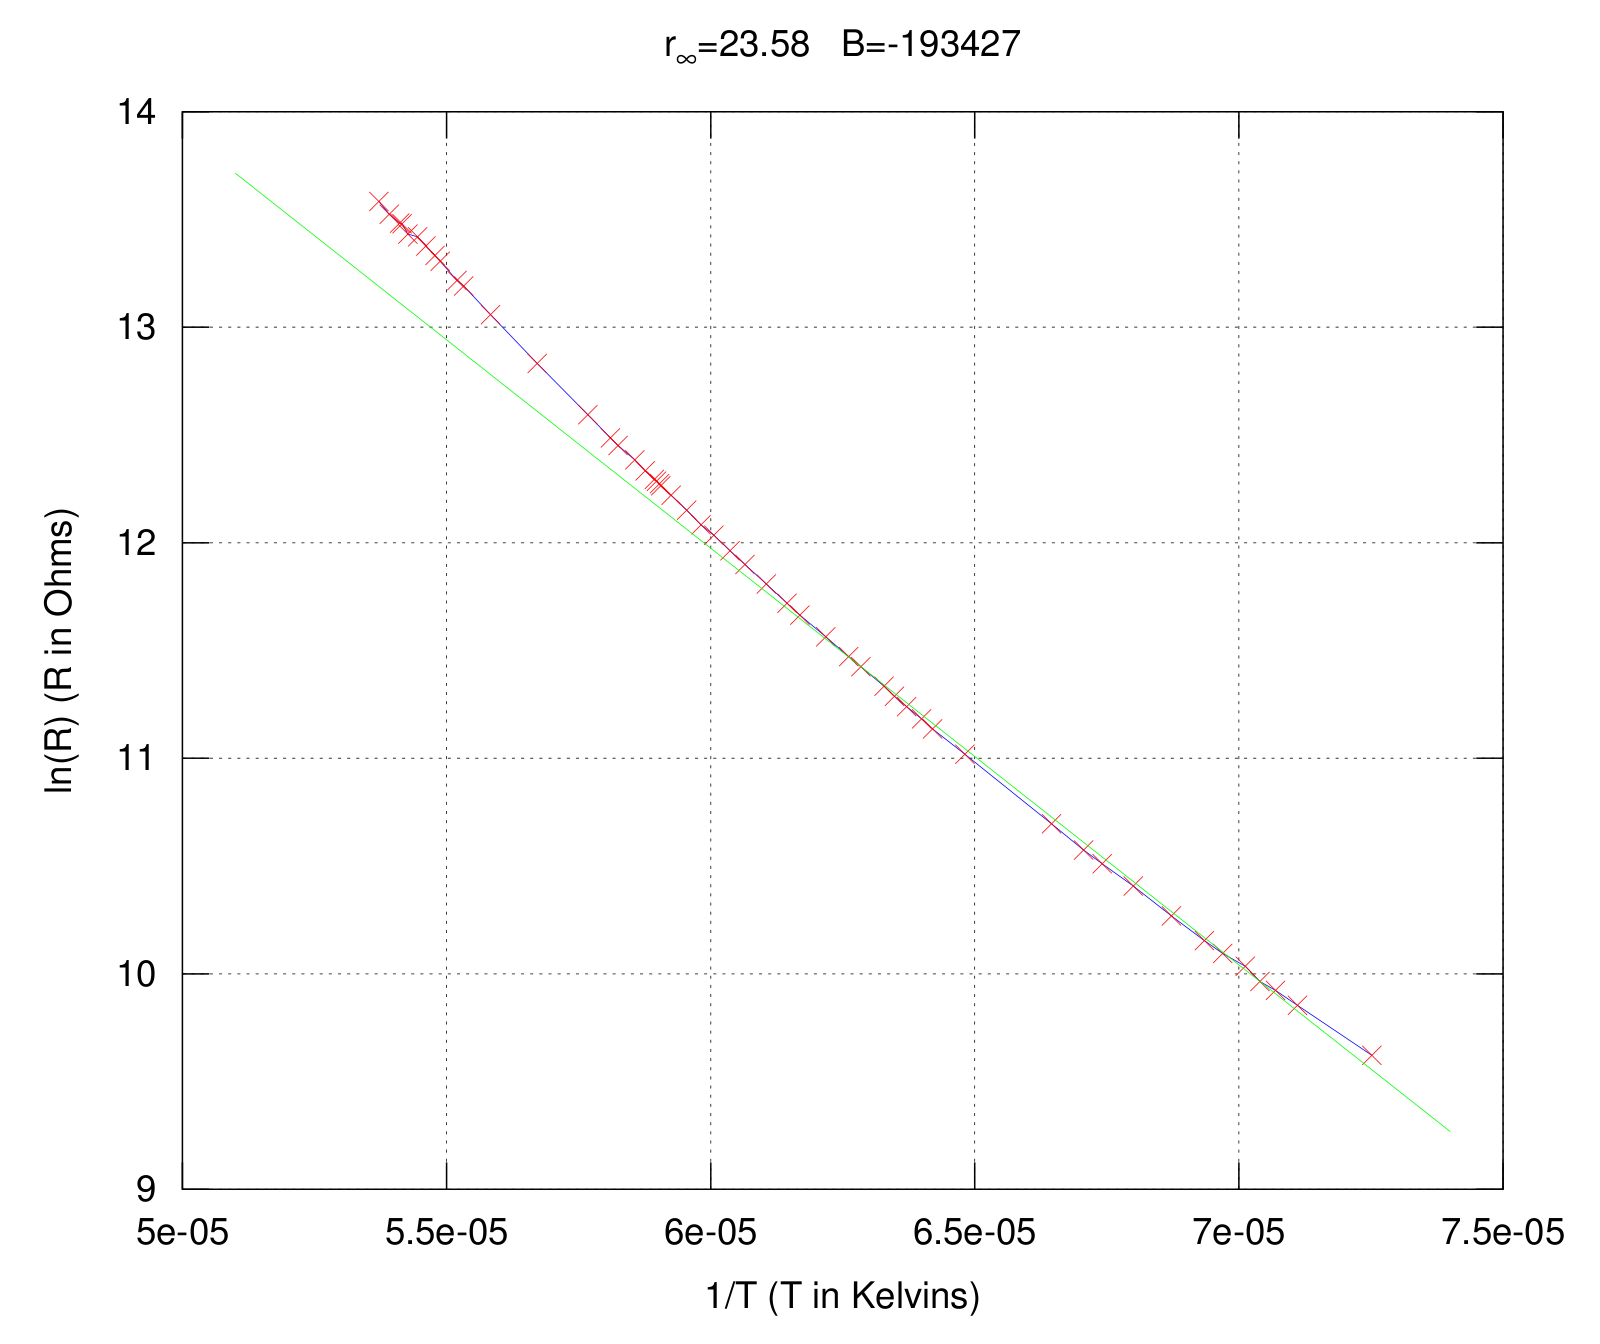
A linear fit was found between 1/T (in kelvins) and ln(R) in ohms,
for the samples in the range of interest in this data, 90F-200F.
Image
From this we can say that ln(R) = B (1/T) + ln(r_inf), hence
R=r_inf * exp(B/T), and
T=B/ln(R/r_inf)
This simple relation may be sufficient to work with our sensors.

However, I note that the quadratic fit, cyan line, does a much better job of matching data that was not fit.
Image
This seems to be a very good model for our thermistor. Hence parameters from this fit could be used for greater accuracy.

It may be that my reference thermometer has a parabolic fit to this curve, so I'm just reproducing their table. This may be as good as I can do with the reference measurements I have.

I don't know the motivation for some references plotting these relationships as ln(R) vs. 1/T(kelvins). It looks similarly curved when I just plot ln(R) vs. T. Although I try to use metric in most of my work, I still think about cooking in F. So I did a simpler fit for the resistance curve in ln(R) vs. degrees F.
Image

Mr.What
Administrator
Posts: 197
Permalink
Post Voltage-Temperature Curve
on: January 12, 2012, 14:27
Quote RemoveEdit

The temperature I'm most interested is in the neighborhood of 200F. The resistance at that temperature is around 20K. If I want the center of my sensed range to be near my most critical temperature, I choose the resistor used in my voltage divider to be near the thermistor resistance at this temperature, around 20K. I in this plot, I include curves for other bias resistance.
Image
If I had more high-temperature data, I'd expect my Rb=20K curve to take on the sigmoid shape I see in the Rb=100K curve as the temperature goes toward my high-end range of around 400F. It looks like a simple voltage divider with Rb near the resistance measured at 200F will work well.

The 5% resistor I chose for my voltage divider actually measured a resistance of R0=22.00 KOhms. I hard coded this calibration into the microcontroller software as the nominal calibration, so we can more easily enter set points in degrees F. I was planning on leaving all calibration to the graphical user front-end software, to run in Java on PC/LINUX or Android. However, I am finding it desirable to enter data in degrees F over the serial interface by hand until I build such a front end.

The conversion from sensor counts to temperature for this resistor and thermistor voltage divider is:
Image

Mr.What
Administrator
Posts: 197
Permalink
Post Thermistor Sensing Circuit
on: January 12, 2012, 17:41
Quote RemoveEdit

Thermistor probe will be connected in a voltage divider circuit to one of the Arduino 10-bit analog inputs to achieve (nearly) above temperature to counts curve.

Image

Mr.What
Administrator
Posts: 197
Permalink
Post Motor Driver
on: January 12, 2012, 17:43
Quote RemoveEdit

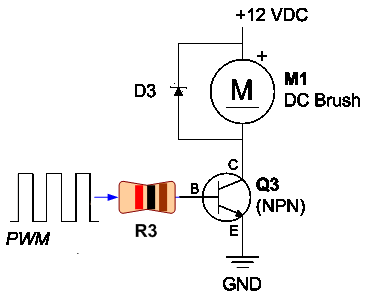
The Arduino produces a PWM output to control motor speed. I use this output to switch a transistor to emulate a lower voltage input to the fan.

Image

For my circuit, I actually use a Darlington power switching transistor, since it will have less base current drain. I can then attach an LED to the command signal to have a display of the current fan command level.

I also added a capacitor in parallel to the motor to help smooth out
the input voltage.

I made a separate Fan Control Module, with the transistor attached to the metal plate on the project box for a heat sink. This module is placed close to the fan inlet for cooling.
Image

Mr.What
Administrator
Posts: 197
Permalink
Post Step Test
on: February 1, 2012, 09:54
Quote RemoveEdit

Instead of a fan, the control output was attached directly to the heater wire from a toaster. Wire resistance was about 10 ohms. Given a 12v input to the power transistor, this gives us a power output of up to about 11 watts. The original placement was not working well, so at about 45 minutes, the thermistor probe was placed on top of the heater, and both of them were placed under a ceramic bowl to hold some heat. Temperature was recorded as heat input was varied.

Image

From this I guessed a time constant of around 10 minutes, and chose to set Td for closed loop experiments around 5 minutes.

The official definition for time constant is the amount of time it takes for a system to reach 63% of it's response to a step input. Sometimes they split this time into a lag-time plus a time constant, where the lag time is the amount of time it takes for the system to BEGIN it's response. It is a bit hard to tell where to draw this line. For my simple test heater, one might say that it has a .5-1 minute lag, and then another 9-10 minutes time constant.

The key lesson to learn from this test is that the integration time, Ti should be on the close order of 10 minutes for this system.

Mr.What
Administrator
Posts: 197
Permalink
Post Initial Closed Loop test
on: February 2, 2012, 11:11
Quote RemoveEdit

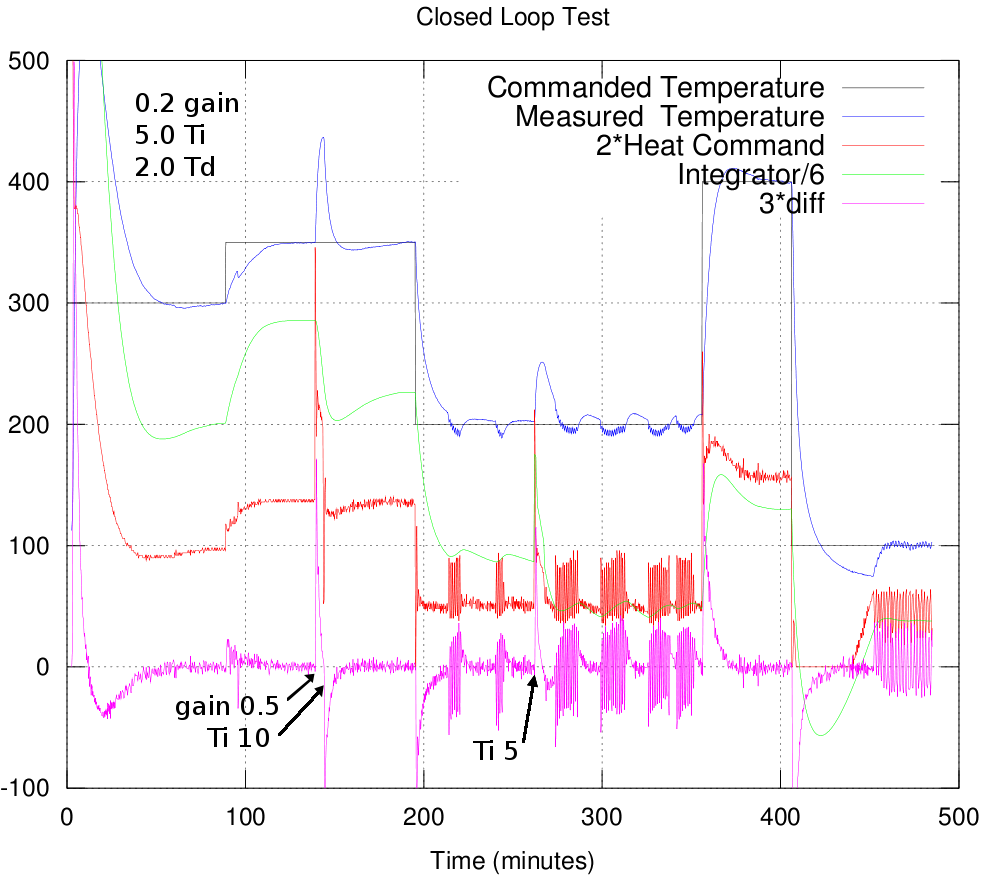
The initial closed loop settings of .2 gain, 5 Ti, 2 Td worked pretty well. Had desired overdamped response. Increased gain to to .5 with 10 minute Ti produced some overshoot and oscillations. I think this could have been due to too much lag in the differential estimate.

Image

Reducing Ti to 5 still had overshoot, but less oscillations.

Oscillation at low command levels are believed to be due to some hysterisis logic in the heater command, which was intended to be for a fan. Below a certain threshold the heater is just turned off. These bang-bang inputs cause some oscillations. Future tests will try to avoid these low heat levels.

Mr.What
Administrator
Posts: 197
Permalink
Post Second Closed Loop Test
on: February 2, 2012, 11:52
Quote RemoveEdit

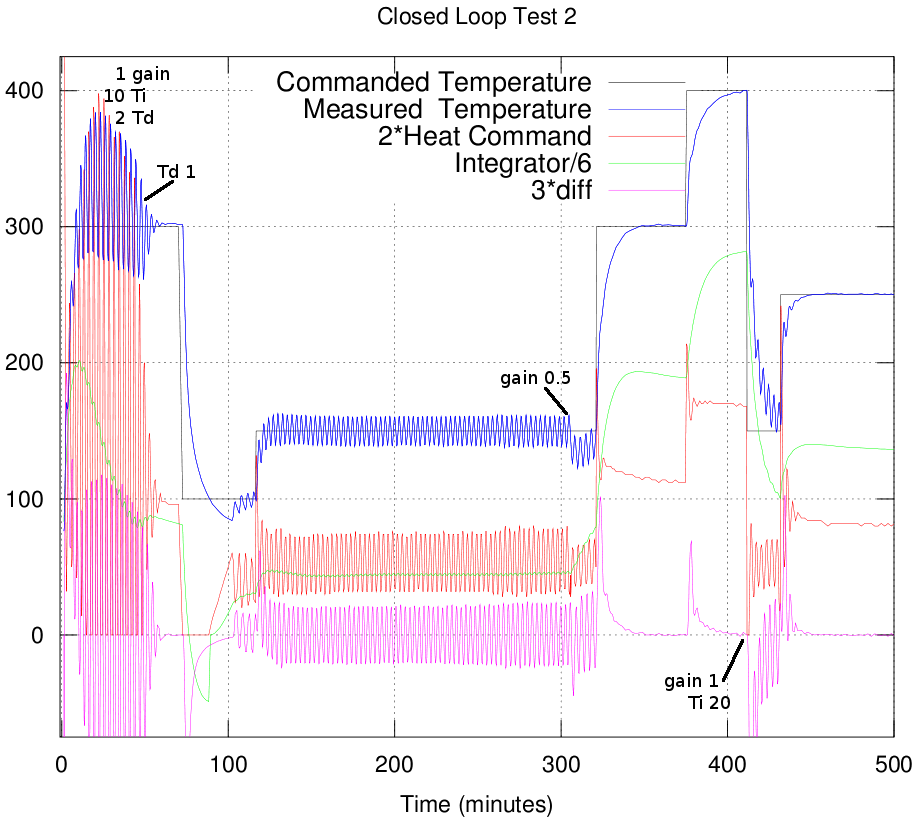
Another series of closed loop tests, with higher gain, attempting to get faster response. Most were jittery. Responses smoothed out at gain 0.5 (305 to 430 minutes)

Jittery with Td=2, before 50 minutes. Reducing differential sensitivity reduced jitter. Gain still produced jitter at lower command rates. Reducing gain produced a much better step response. Increasing gain increased jitter again.
Image

Gain 1 had OK step up response to higher temperature.

Mr.What
Administrator
Posts: 197
Permalink
Post More Closed Loop tests
on: February 5, 2012, 09:55
Quote RemoveEdit

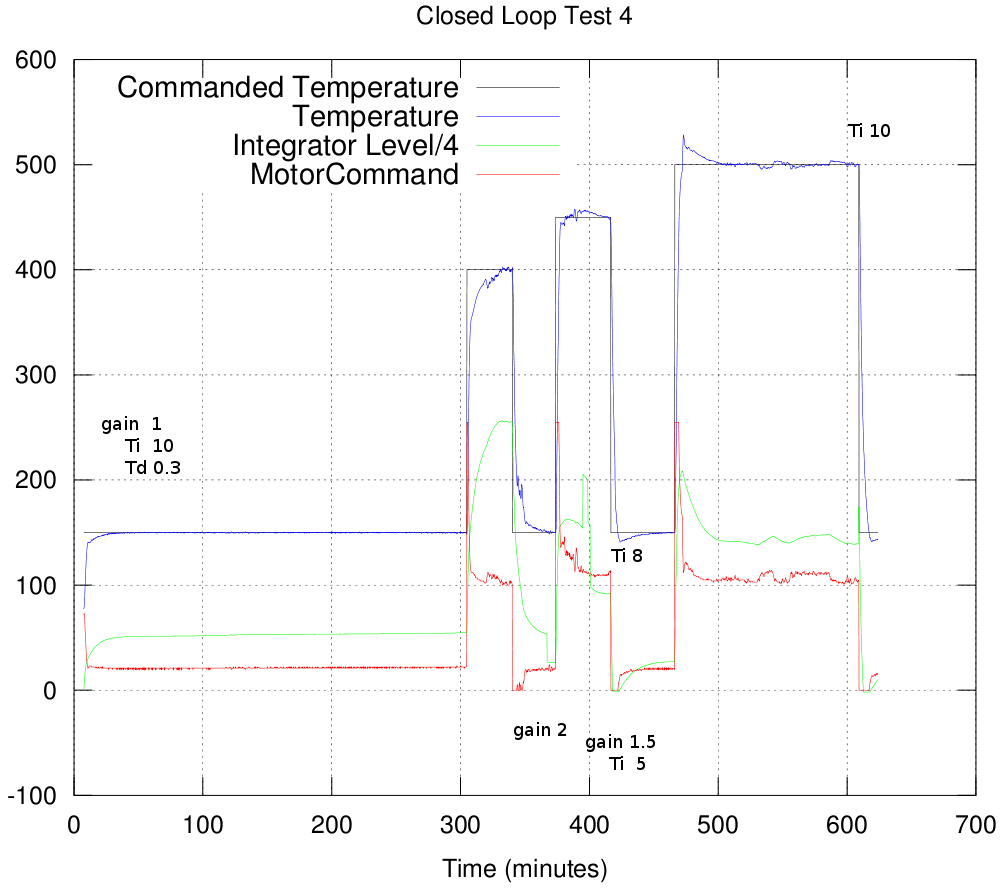
Did more closed loop tests. Decided to get rid of Differential. I don't think it helped much. There is lag in the system, and the reliability of this is tricky. Collected wisdom, for plants which are not well characterized, or highly non-linear, is that Td should be about Ti/4.

For the future, things should be easier to tune with only a gain and a Ti, especially when the Ti should be close to the time constant, which can readily be measured with a step test.
Image
Image

Mr.What
Administrator
Posts: 197
Permalink
Post PI with kick
on: February 5, 2012, 10:16
Quote RemoveEdit

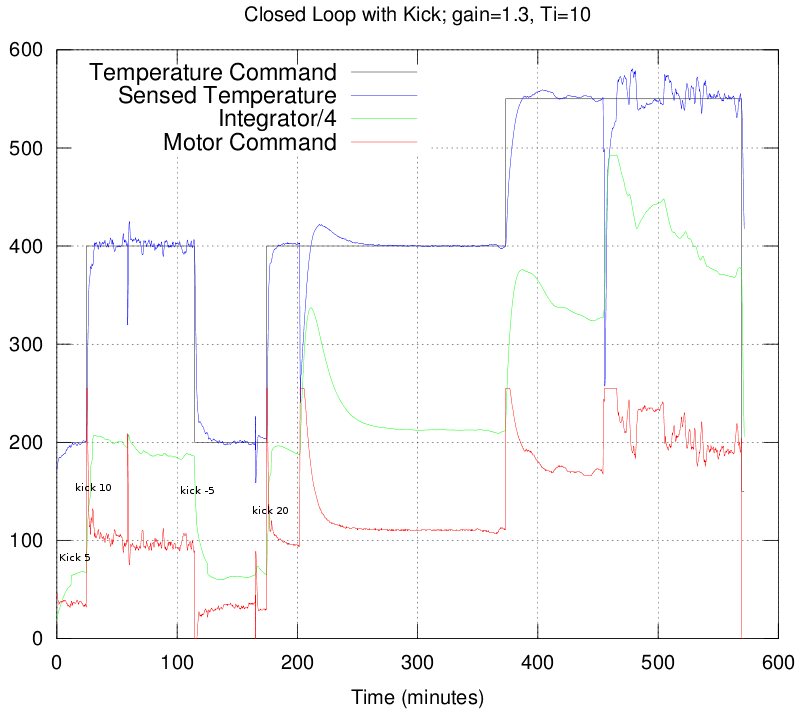
Basic PI controller, with "kick" function. This function allows you to "kick" the heat command by a specific number of counts by altering the level of the integrator. This allows a manual operator to override and improve on the default overdamped behavior. This tests includes some disturbances.
Image
Note the overshoot on the large disturbance around 200. I cooled the sensor, and then when re-assembling, I insulated. This changed the plant significantly, and gave overshoot. Note the very rapid response to the first command change, assisted with the kick command.

It looks like PI control will be sufficient, and easier to manage than PID for this thermal control application. The title of the topic is now kind of deprecated.

Simple calibration procedure: Do a step-test in open loop. Take a guess at "response time". Set this time as Ti. Then frob gain to match your plant.

My smoker has two air intake ports. I plan to use only one with the fan control. The other will set "gross" air intake. The controlled air intake is just for fine temperature control.

adric
Administrator
Posts: 178
Permalink
Post Re: PID Temperature Controller
on: February 10, 2012, 15:33
Quote RemoveEdit

Silly question, but what are you using to generate the data graphs?

-Quelab, Come make something!

Mr.What
Administrator
Posts: 197
Permalink
Post Re: PID Temperature Controller
on: February 10, 2012, 15:56
Quote RemoveEdit

octave. open source MATLAB-like product. print to PDF for nice, clean compact vector graphics (~9k files). Then use GIMP to convert to PNG, making files look much worse, but at least it expands them to over 100K ;-)

Mr.What
Administrator
Posts: 197
Permalink
Post Re: PID Temperature Controller
on: August 1, 2012, 07:18
Quote RemoveEdit

Here is a good article on PID for the non engineer:

http://quelab.net/wordpress/wp-content/uploads/2012/01/PID-without-a-PhD.pdf

The form I ended up using for the PID control law was:

   command = gain * (err + integratedErr/Ti - Td*dedt)

This is convenient since there are some rules of thumb for setting Ti, Td, and gain.
The units of gain are the conversion from measurement error to control command units.
Ti and Td are both time units. (seconds, minutes, samples...)

Ti is usually on the order of the system's time constant. A good guess for Td is around 0.25*Ti. Turn up the gain until the system starts to oscillate, then back off a little.

I think that many common formulations have a control law like:

   command = Kp * err + Ki * integratedErr - Kd * derrdt

Hence, for the above notation,

    Kp == gain
    Ki == gain/Ti
    Kd == gain*Td

Measuring Time Constant:

The time constant is often measured with a step test.

  • Set the command (heater level) to a "typical" level, and wait for the temperature to settle. Note this temperature.
  • Set the command to a different level, and log the temperature until it settles to the new level.
  • The time it took for the temperature to move from it's initial level to 63% of the way to the new level is the system's time constant.
Quick Reply:

Pages: [1]
 ReplySubscribeRSS feedStickyClose   
Mingle Forum by cartpauj
Version: 1.0.34 ; Page loaded in: 0.044 seconds.

[Edit Page]
 

Comments are closed.

Hacknight Edit
Jun 18 @ 7:00 pm – 10:00 pm
Our twice-weekly open house. Come learn what we’re all about! This is when both members and non members are encouraged to come in and work/start/help [...]